Why the angle matters
A narrowband astronomy filter is an interference filter. It reflects the unwanted wavelengths rather than absorbing them, using a stack of thin dielectric layers. The layers are tuned so that light at one particular wavelength interferes constructively on its way through. A 6 nm hydrogen alpha (Hα) filter passes a 6 nm-wide window centered on 656.3 nm and rejects the rest.
This tuning depends on the path length through the layer stack, which in turn depends on the angle of incidence. When the filter is tilted, the effective path shortens and the passband shifts toward shorter wavelengths. This is approximated by:
λ(θ) ≈ λ₀ · √( 1 − (sinθ / n_eff)² )where θ is the angle of incidence and n_eff is the effective refractive index of the coating stack. Setting n_eff ≈ 2 as an approximation gives the following shifts for a 6 nm Hα filter.
| Tilt | Band center | Shift | As a fraction of a 6 nm band |
|---|---|---|---|
| 0° | 656.3 nm | — | — |
| 2° | 656.2 nm | −0.1 nm | 2% |
| 5° | 655.7 nm | −0.6 nm | 10% |
| 10° | 653.8 nm | −2.5 nm | 41% |
At 10°, the window moves almost half its own width off the emission line being photographed. When the filter is mounted at an angle, the angle of incidence is also not uniform across the frame. Light reaching the left edge of the sensor arrives at a different angle than light reaching the right edge. The passband is therefore shifted by different amounts across the frame, which produces uneven brightness and a color gradient, and reduces the signal on one side of every exposure.
A mounting error of two degrees is hard to judge by eye. The effect is there, and one side of the frame does look slightly pinker than the other, but it is subtle enough that estimating the angle from it is not practical.
Demonstrating the shift
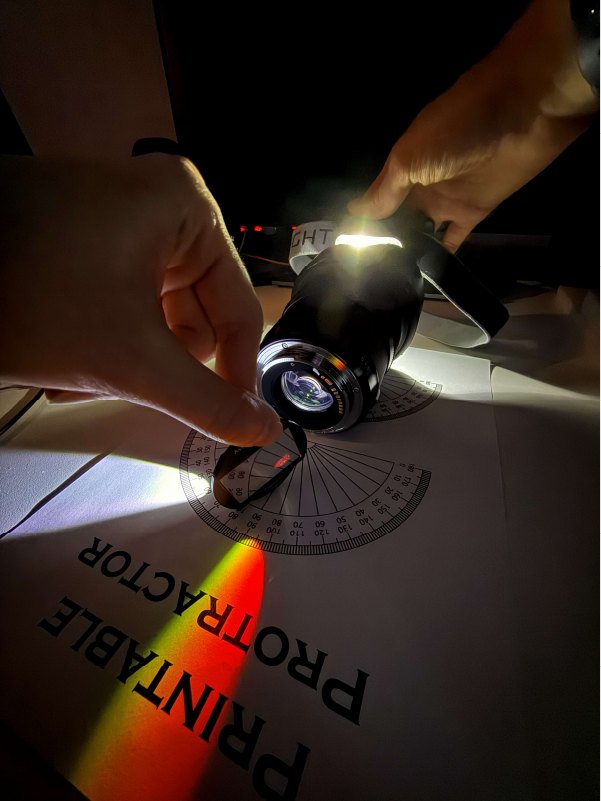
The effect can be shown directly with a white LED, a printed protractor and the Hα filter held at increasing angles.
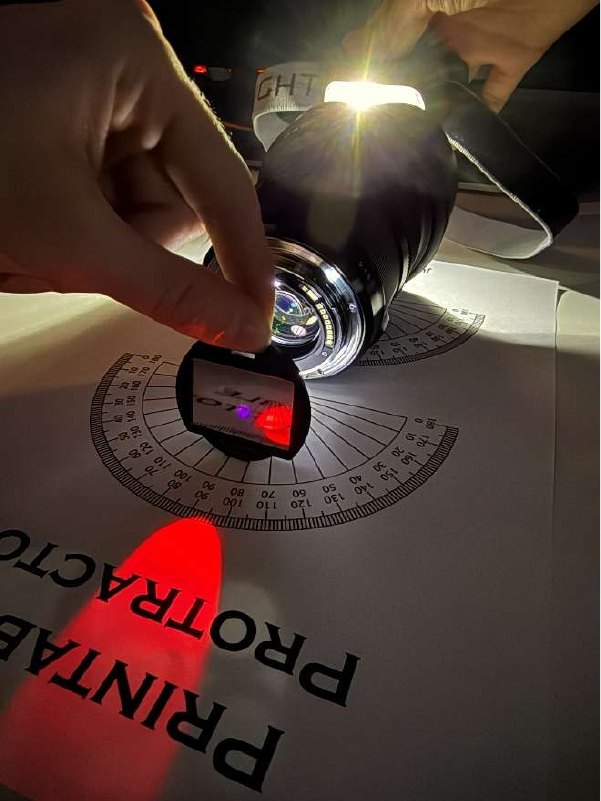
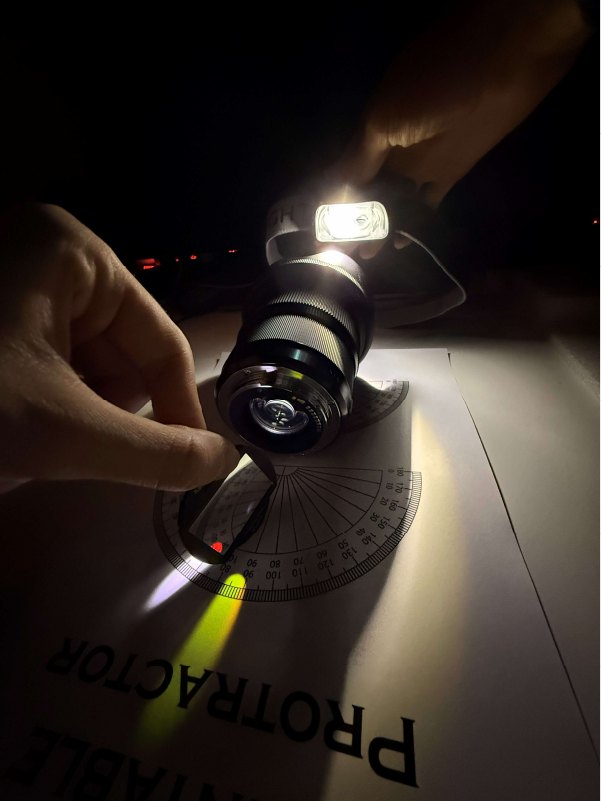
These angles are large, at tens of degrees, and far greater than a mounting error would produce. The same effect occurs at 2°, where it is faint but not invisible: one side of the frame comes out slightly pinker than the other. The script measures that difference rather than relying on the eye to judge it.
Method: three frames of one LED
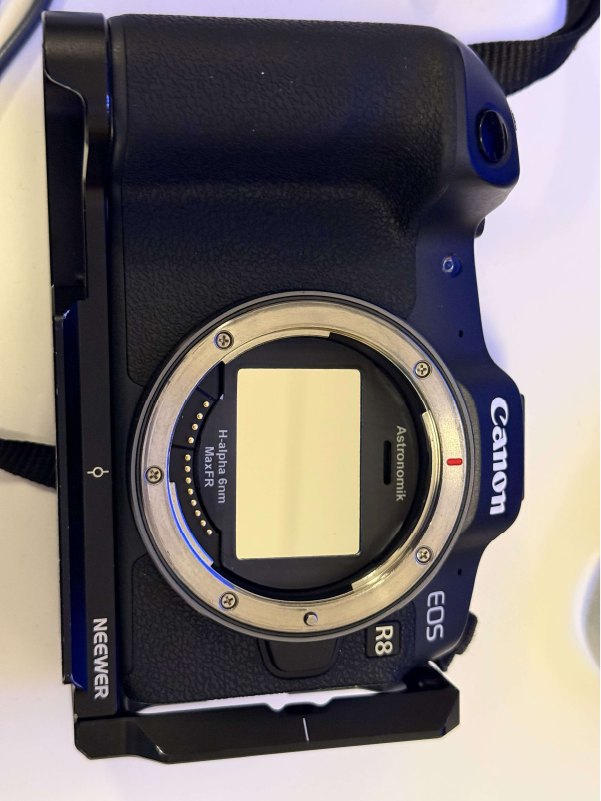
The filter is placed in front of the sensor and a small bright source is photographed in three positions: in the center of the field of view, toward the left edge, and toward the right edge. The exposure settings are kept the same for all three.
If the filter is parallel to the sensor, the left and right frames are symmetric. If it is tilted about the vertical axis, they are not, since light reaches one side at a steeper angle than the other and the passband there has shifted further.
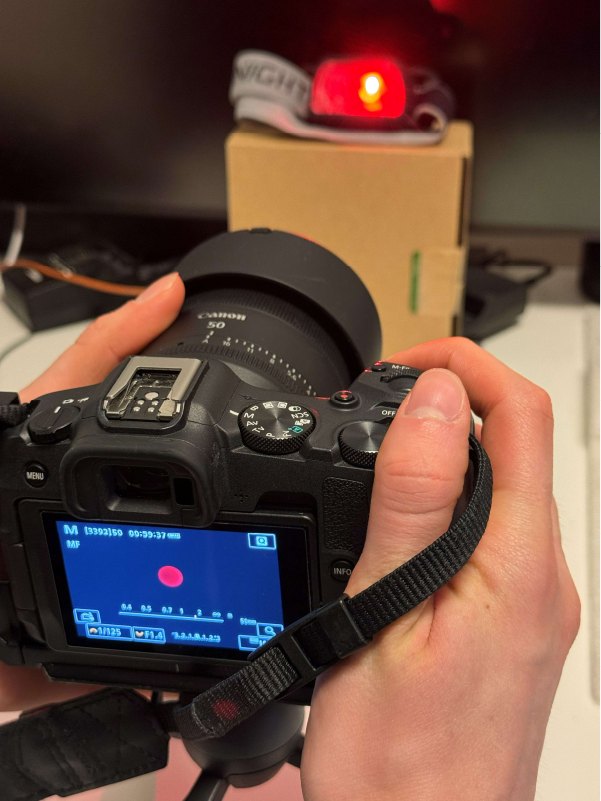
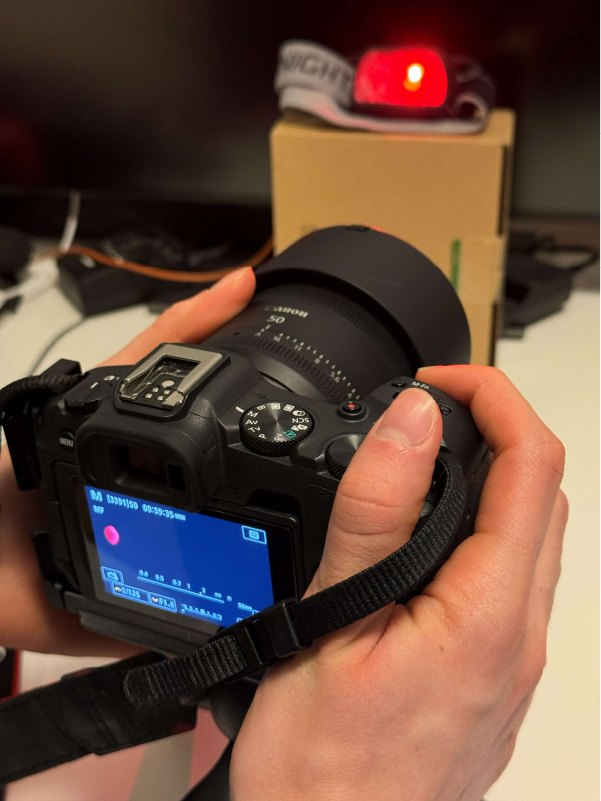
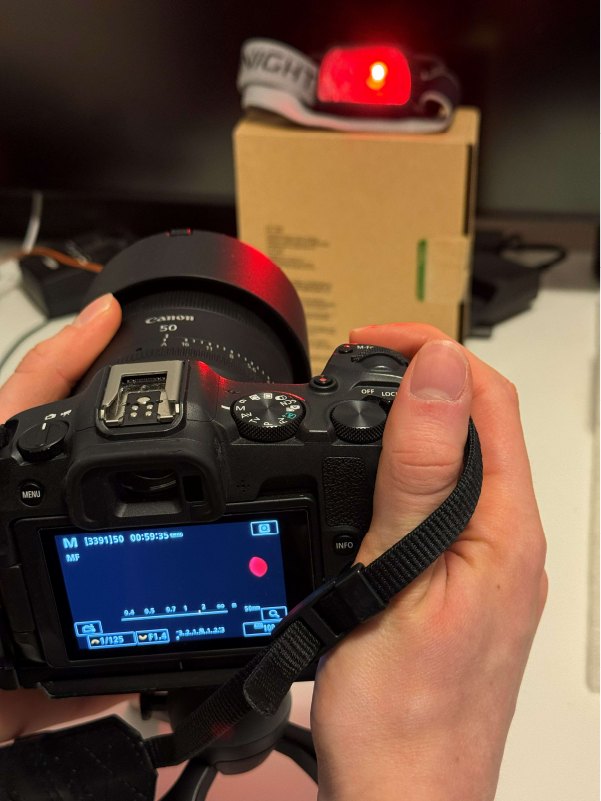
In the RAW frames, the LED is a small dot against a mostly black background.
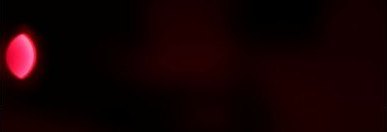
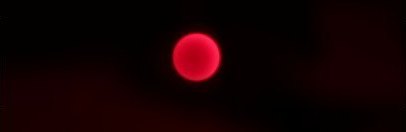
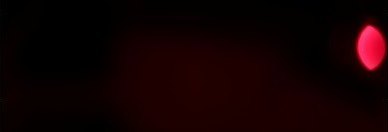
Averaging over the whole frame would drown the signal in black pixels, so the source is located first. The script identifies every pixel more than four standard deviations above the channel mean as belonging to the light source, takes the bounding box of those pixels, and recalculates the statistics inside that box.
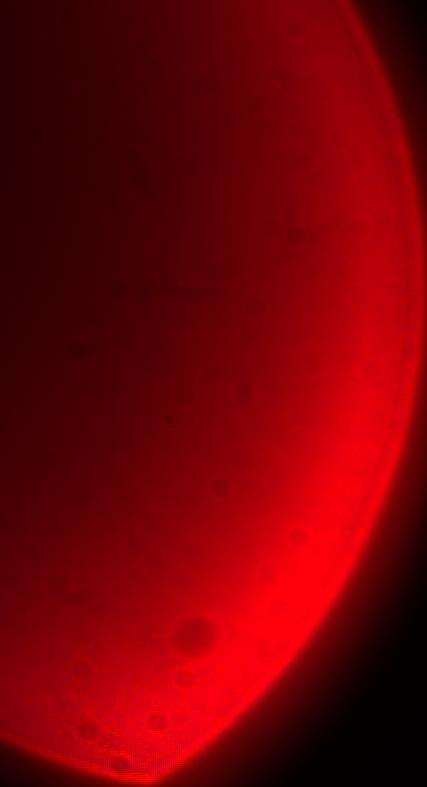
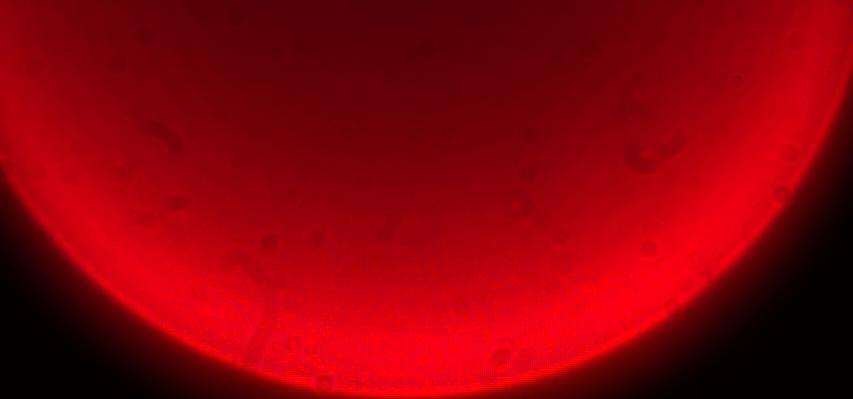
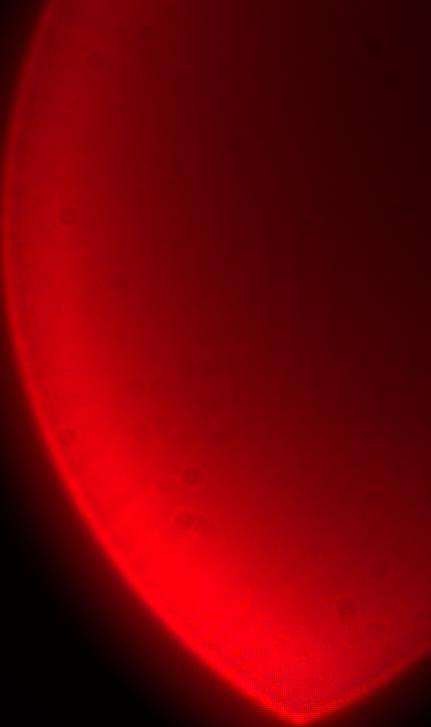
Blue channel profiles
Within each cropped image, the script averages the blue channel along every row and every column, and plots the two profiles. The blue channel is used because it receives the least light through an Hα filter, and therefore responds most strongly when the passband shifts.
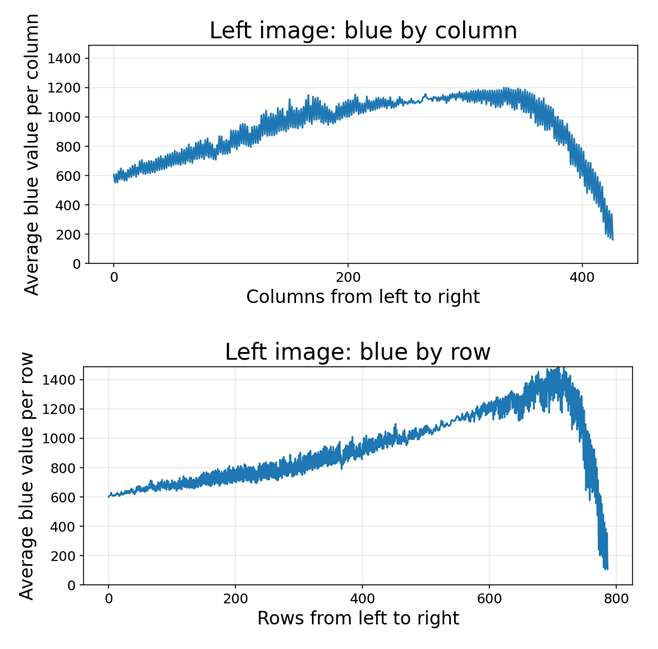
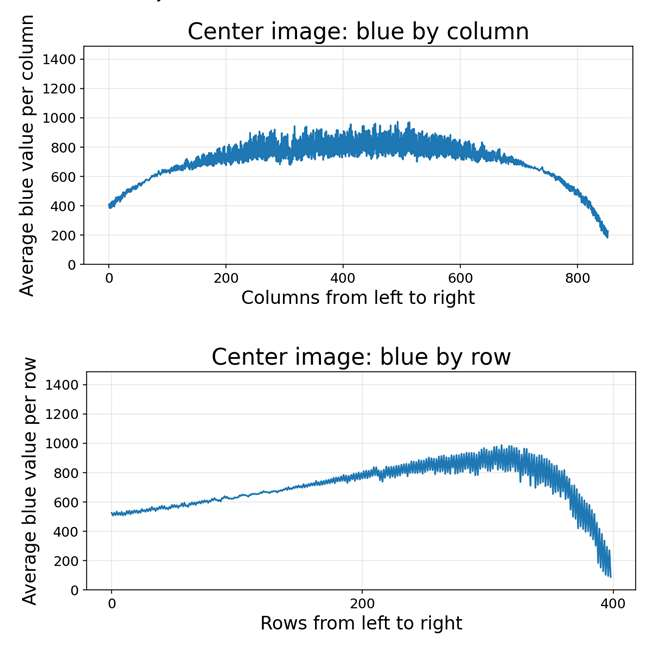
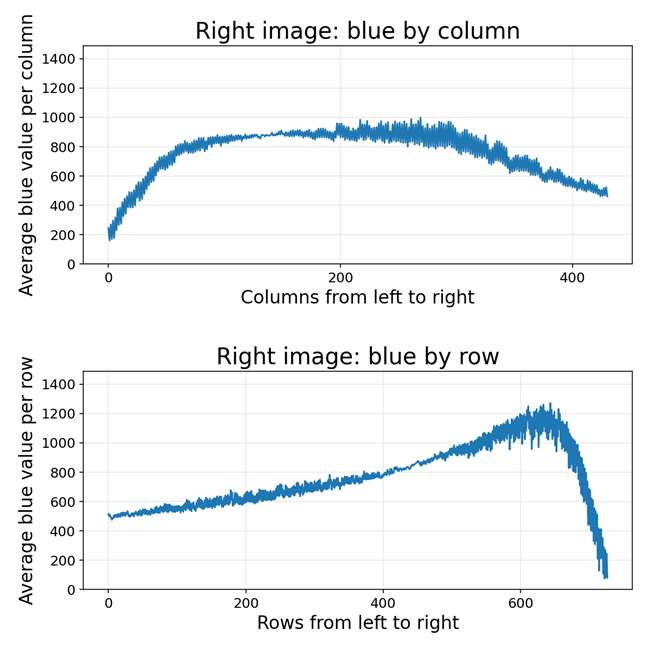
All values are 14-bit RAW values, with no white balance or gamma applied. The left crop peaks at roughly 1200 average blue per column, while the right crop peaks nearer 880, and the two profiles are not mirrored. This is the asymmetry the method detects. A filter mounted parallel to the sensor would produce two profiles that are near-reflections of each other, both similar in height to the center frame.
The verdict is not read off the plots. For each frame, the script computes the ratio of each color channel relative to the total light, compares the left and right ratios, and applies two rules.
- Channels contributing less than 2% of the total light are skipped, since below that the comparison is between noise values.
- If any remaining channel's ratio differs between left and right by more than 10%, the filter may be tilted.
Ratios are used rather than absolute values. The LED is not at the same distance from the lens in every shot, and vignetting darkens the edges of the frame. Both change the total amount of light collected, but neither changes how that light is divided between the color channels. Only the filter's passband does that.
Usage
pip install rawpy Pillow numpy matplotlib

python tiltedfilter.py \
  --center path/to/center.CR3 \
  --left   path/to/left.CR3 \
  --right  path/to/right.CR3
If no arguments are given, the script uses the filenames hardcoded at the top of the file. It writes center_crop.jpg, left_crop.jpg and right_crop.jpg, plus <position>_blue_by_column.png and <position>_blue_by_row.png for each of the three. The plots share a y-axis so that they can be compared. The script then prints one of two lines.
Your filter seems to have been mounted properly (parallel to the sensor).
Your filter might be tilted.
Inside the script
Everything lives in one AstroImageAnalyzer class: create_arr() loads the CR3 through rawpy and hands back a 16-bit RGB array; calc_stdev() takes the per-channel mean and standard deviation; crop() finds the bounding box of pixels above the sigma threshold; crop_to_jpeg() writes an 8-bit preview, which is used to check that the crop landed on the LED and not on a hot pixel; and blue_shift() builds the row and column profiles. A free function is_it_tilted() applies the two rules above, and _blue_plot_max_from_cropped() works out the shared y-axis maximum before any plotting starts.
The pipeline for each frame is: load → statistics → crop → statistics again. Recomputing after cropping is the important part: the first pass exists only to locate the light source, and every number used in the verdict comes from the second.
Tested configurations
Three combinations have been tested so far.
- Red bike LED + 6 nm Hα
- Works. Correctly flags a tilted filter and correctly passes a properly mounted one. The automatic verdict is reliable for this pairing.
- White bike LED + 6 nm OIII
- Partly. Cropping and analysis work correctly, but the tilt signal is much weaker, and the automatic verdict may not flag a filter that is genuinely tilted. The reported left-versus-right percentage differences should be checked manually.
- Ulanzi RGB light + 6 nm OIII
- Works. This source puts far more energy through an OIII filter than a white bike light does, and the tilt is detected correctly.
The method depends on the match between the light source and the filter. The source must emit both inside and just outside the filter's passband, so that a small shift in the band produces a large change in the transmitted light. The OIII result with a white LED is therefore a limitation of the light source rather than of the method.
Two further limitations. The test detects tilt about the vertical axis only, since left and right are the only positions compared. A filter rotated about the horizontal axis would require top and bottom frames and the same analysis. Additionally, the 2% and 10% thresholds were chosen rather than derived. They work for the configurations above, and would need revisiting for a filter of a different bandwidth.
Resources
- Codedelphinusdelphis/Tilted-filters on GitHub — MIT licensed, Python 3
- PDFProject poster — the LED frames and blue-channel profiles, in Swedish
- PDFBench photos — the blue-shift demonstration and the three LED positions